


 9 / 40

ANGLOSPHERE COMPANIES REPRESENT
53% OF TOTAL NUMBER
Domination of Anglosphere corporations
Anglosphere corporations (from the United States, Canada, Great Britain, Australia, South Africa, and Ireland) make up
the majority (53%). Companies from Continental Europe come next (42%). The last group of countries (from non-
Anglophone Africa, Central America, South America, and Asia) represents only 5% of respondents. A geographic
analysis (by continent) shows two major zones: Europe and America, respectively 44% and 31% of the companies
surveyed.
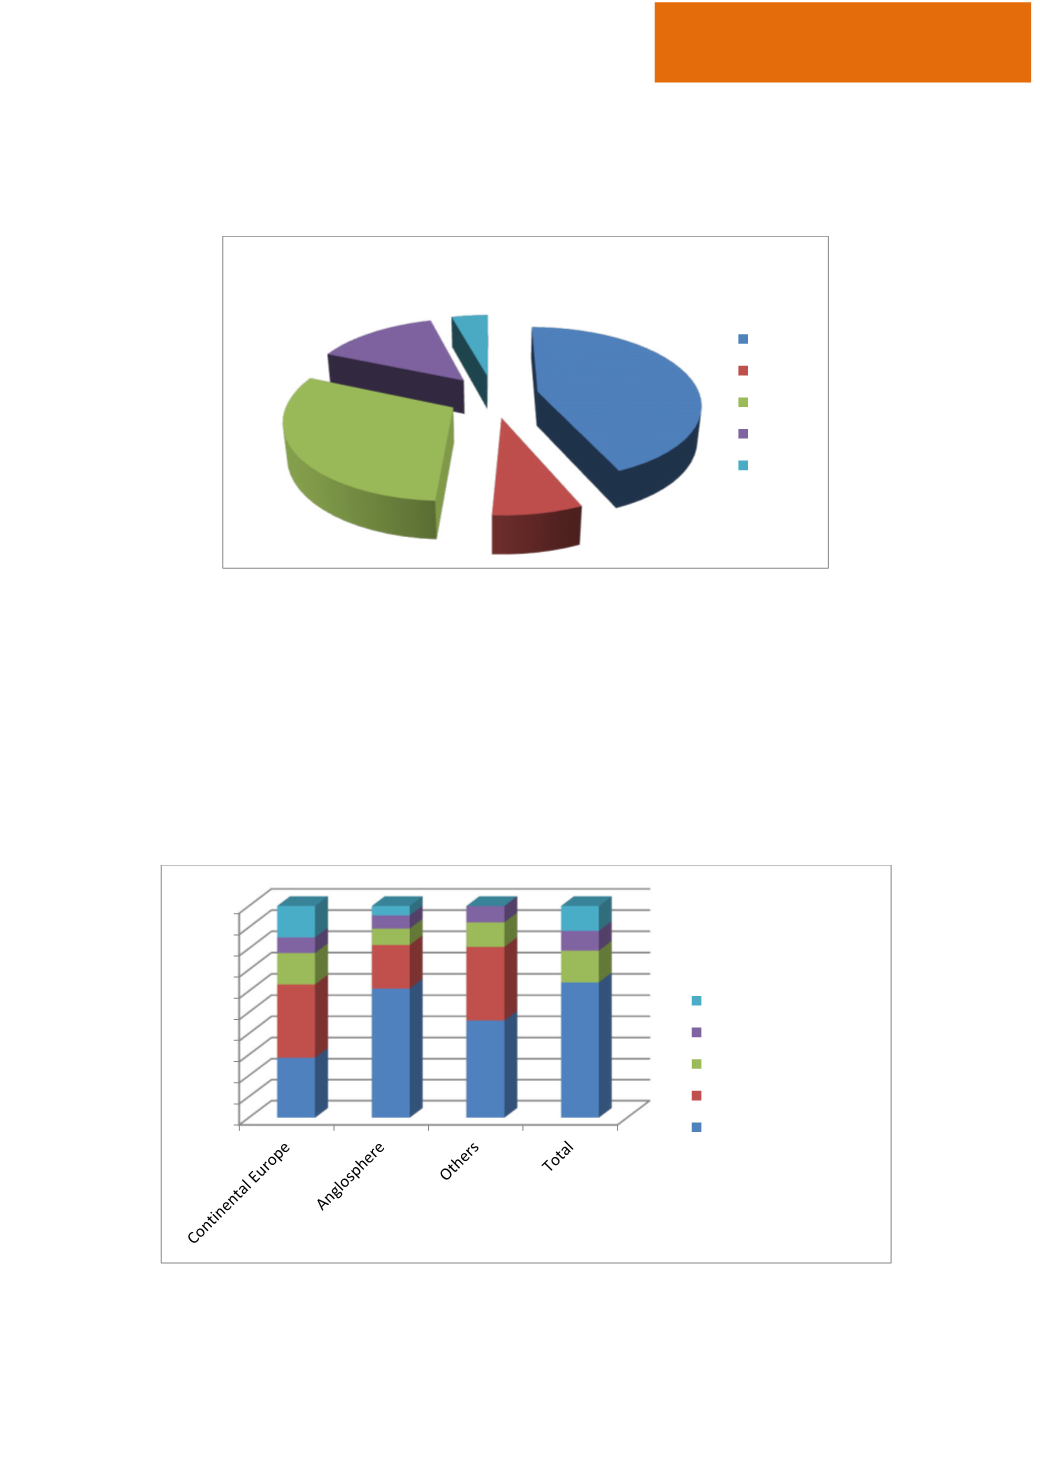
Fig. 1 Breakdown by geographic area
Most companies recorded growth but smaller businesses remain somewhat fragile in
economic terms
The companies with a turnover of less than $250 million constitute an overwhelming majority (74% of the total
sample), but there are significant disparities depending on the socio-economic areas. The Continental Europe group
includes businesses of all sizes, including companies listed on the stock market (16% of the companies included in this
area). The Anglosphere companies are mostly small businesses (61% report revenue under $50 million). Hence,
inevitably, the proportion of listed companies in the sample is lower than last year
’s
(21% vs. 31%).
Fig. 2 Size (revenue) by socio-economic area (%)
Europe
44%
APAC
7%
America
31%
Africa
14%
Other
4%
Europe
APAC
America
Africa
Other
0%
10%
20%
30%
40%
50%
60%
70%
80%
90%
100%
29%
61%
46%
47%
35%
21%
35%
0%
15%
8%
12%
11%
7%
6%
8%
7%
15%
4%
0%
9%
> 5 Billion
from 1 to 5 Billion
from 250 to 999 Million
from 50 to 249 Million
< 50 Million
IAFEI Quarterly | Special Issue | 8