


 22 / 54

has elaborated the budget for the ongoing year and
with a view to the year 2020. For this, for example,
we are looking at what this means for the individual
divisions, where something must happen as regards
future growth, the margin and eventually the cost basis.
Thereby, we are creating transparency. Then we can see
whether we still continue on the road for success. In
addition, we are preparing for capital expenditure and
we are evaluating the profitability and whether it is
matching with our objectives.
Why are the earnings per share such an important
number for you?
It shows to the shareholder what he is earning at the
end. Especially for the American investors this is very
decisive. Still, one third of our share capital is in the
hands of Anglo-American shareholders. This we want to
regard well. The objective is clear: Until 2020 we want
to double the earnings per share from lately 2.50 Euro.
What differentiates your investors from European ones?
American investors are very heavily focused on quarterly
numbers, in Europe this is not so marked. Typically,
Americans have a strong interest in technology and
often they understand it very well.
Is it easier in the USA to explain the strategy of
OSRAM?
Not really, but some investors are more interested and
have good ideas for us and, for example, are proposing
new applications for our products or are proposing
corporations for cooperation. These are good advices
from which we benefit.
As regards the information of the capital market,
OSRAM had to catch up, as the breakdown of the stock
price in autumn 2015 has shown as a reaction to the
new strategy. How would you have approached this?
It is useless to speculate about the past. I was not a part
of it, and therefore I cannot say much about it.
Osram at a glance
Sales
in million Euro
2014/15
2015/16
3572
3785
Ebita**
in million Euro
2014/15
2015/16
363
440
Net Profit
in million Euro
2014/15
2015/16
228
532
Operating Cash Flow
in million Euro
2014/15
2015/16
390
373
* Continued business without Ledvance, business year ends
September 30
** Earnings before interest, taxes and goodwill depreciation
Osram Group Numbers*
Equity Ratio
in percent
2014/15
2015/16
52
52
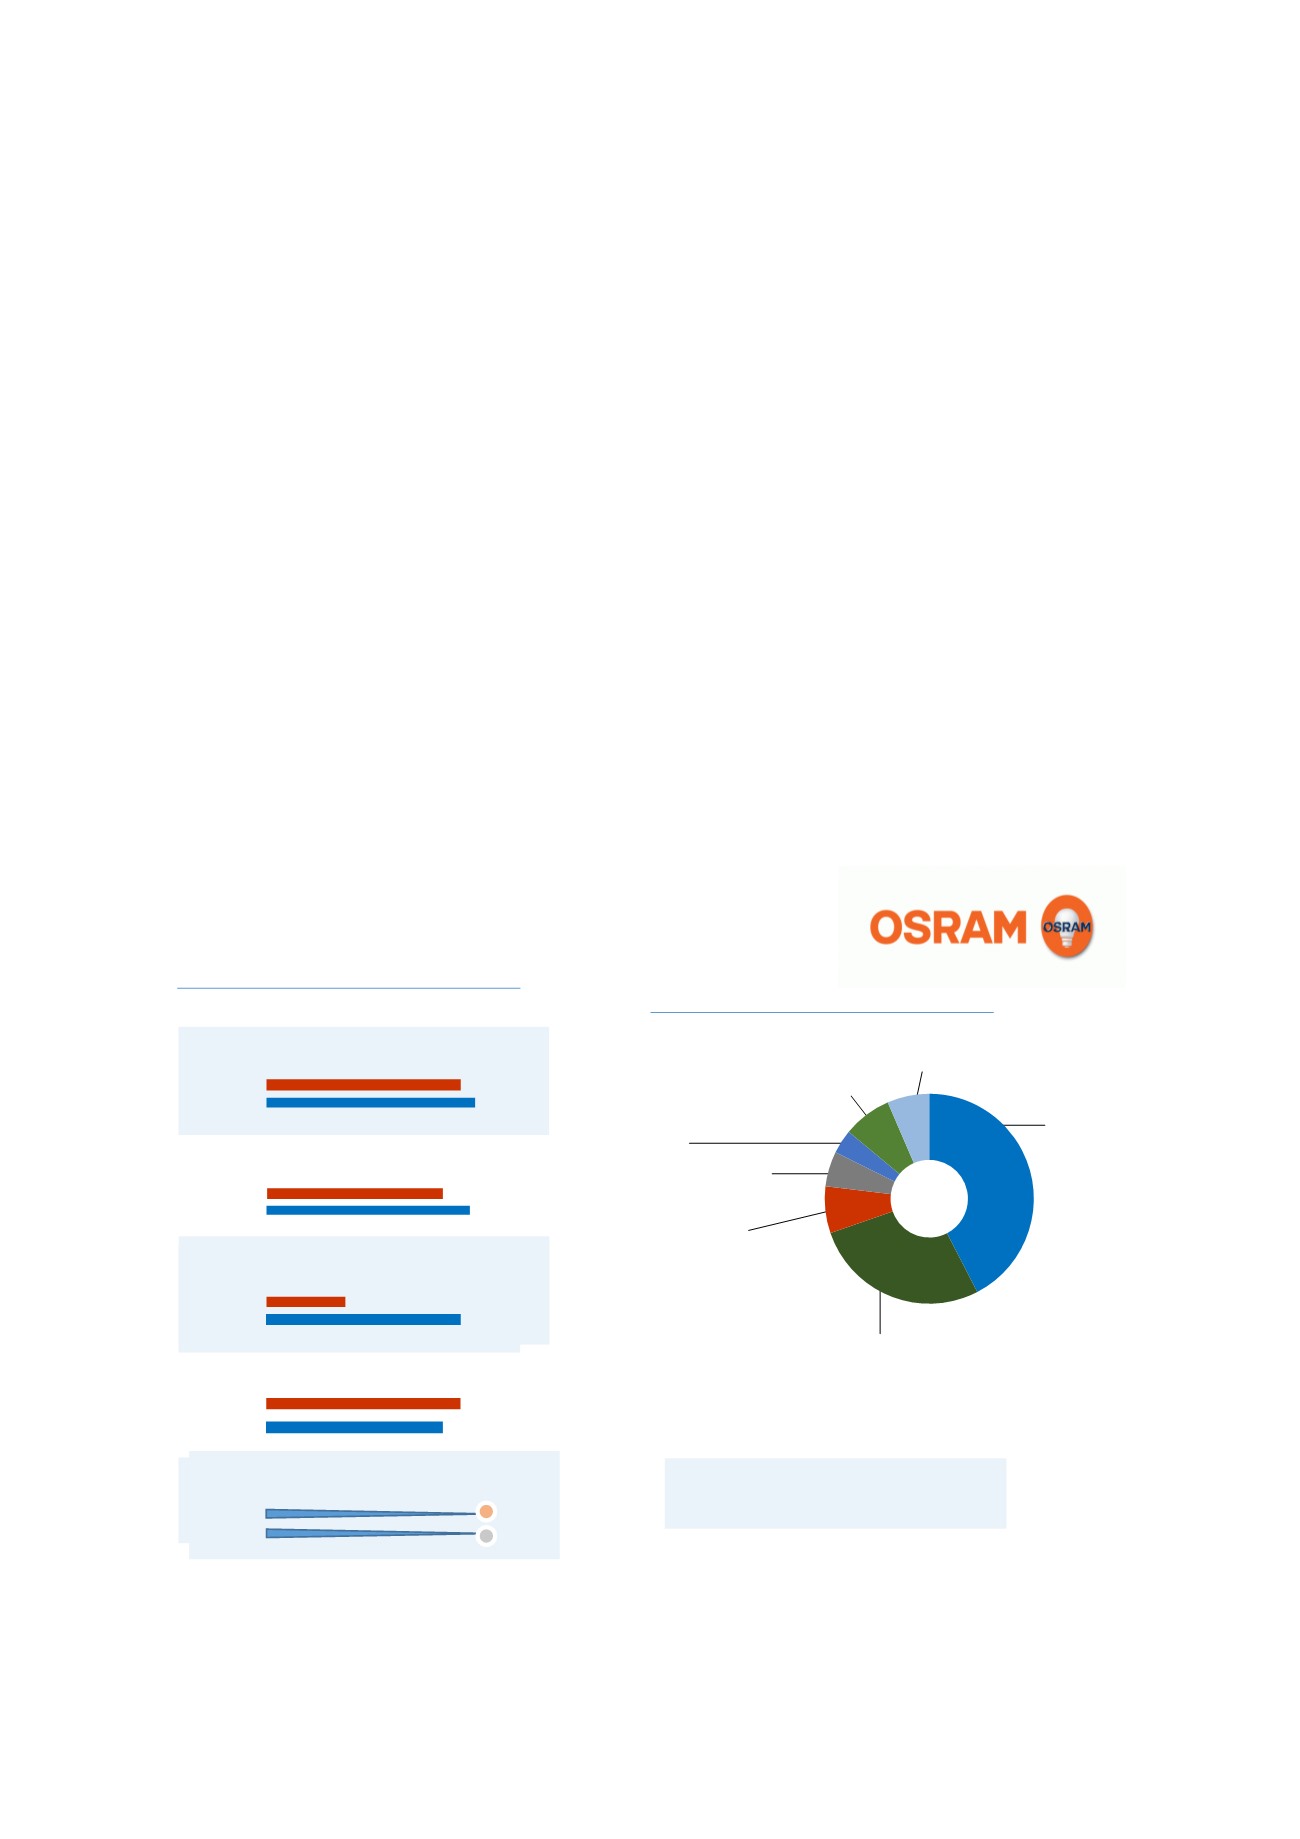
Institutional and strategic Shareholders
France
7,2 %
Norway
3,7 %
Market capitalization
Status July 14, 2017
7.5 billion Euro
Source: Corporation, Thomson Reuters
Germany
42,4 %
UK
5,4 %
Others
6,5 %
USA
27,3 %
therein Siemens
17,5 %
Rest of Europe
7,5 %
Status December 31, 2016; institutional Investors are holding over
80 % of share capital
22