


 19 / 52

18
Any diffusion, publication or exploitation requires to cite the source: International Observatory of
Management Control - DFCG – Decision Performance Conseil
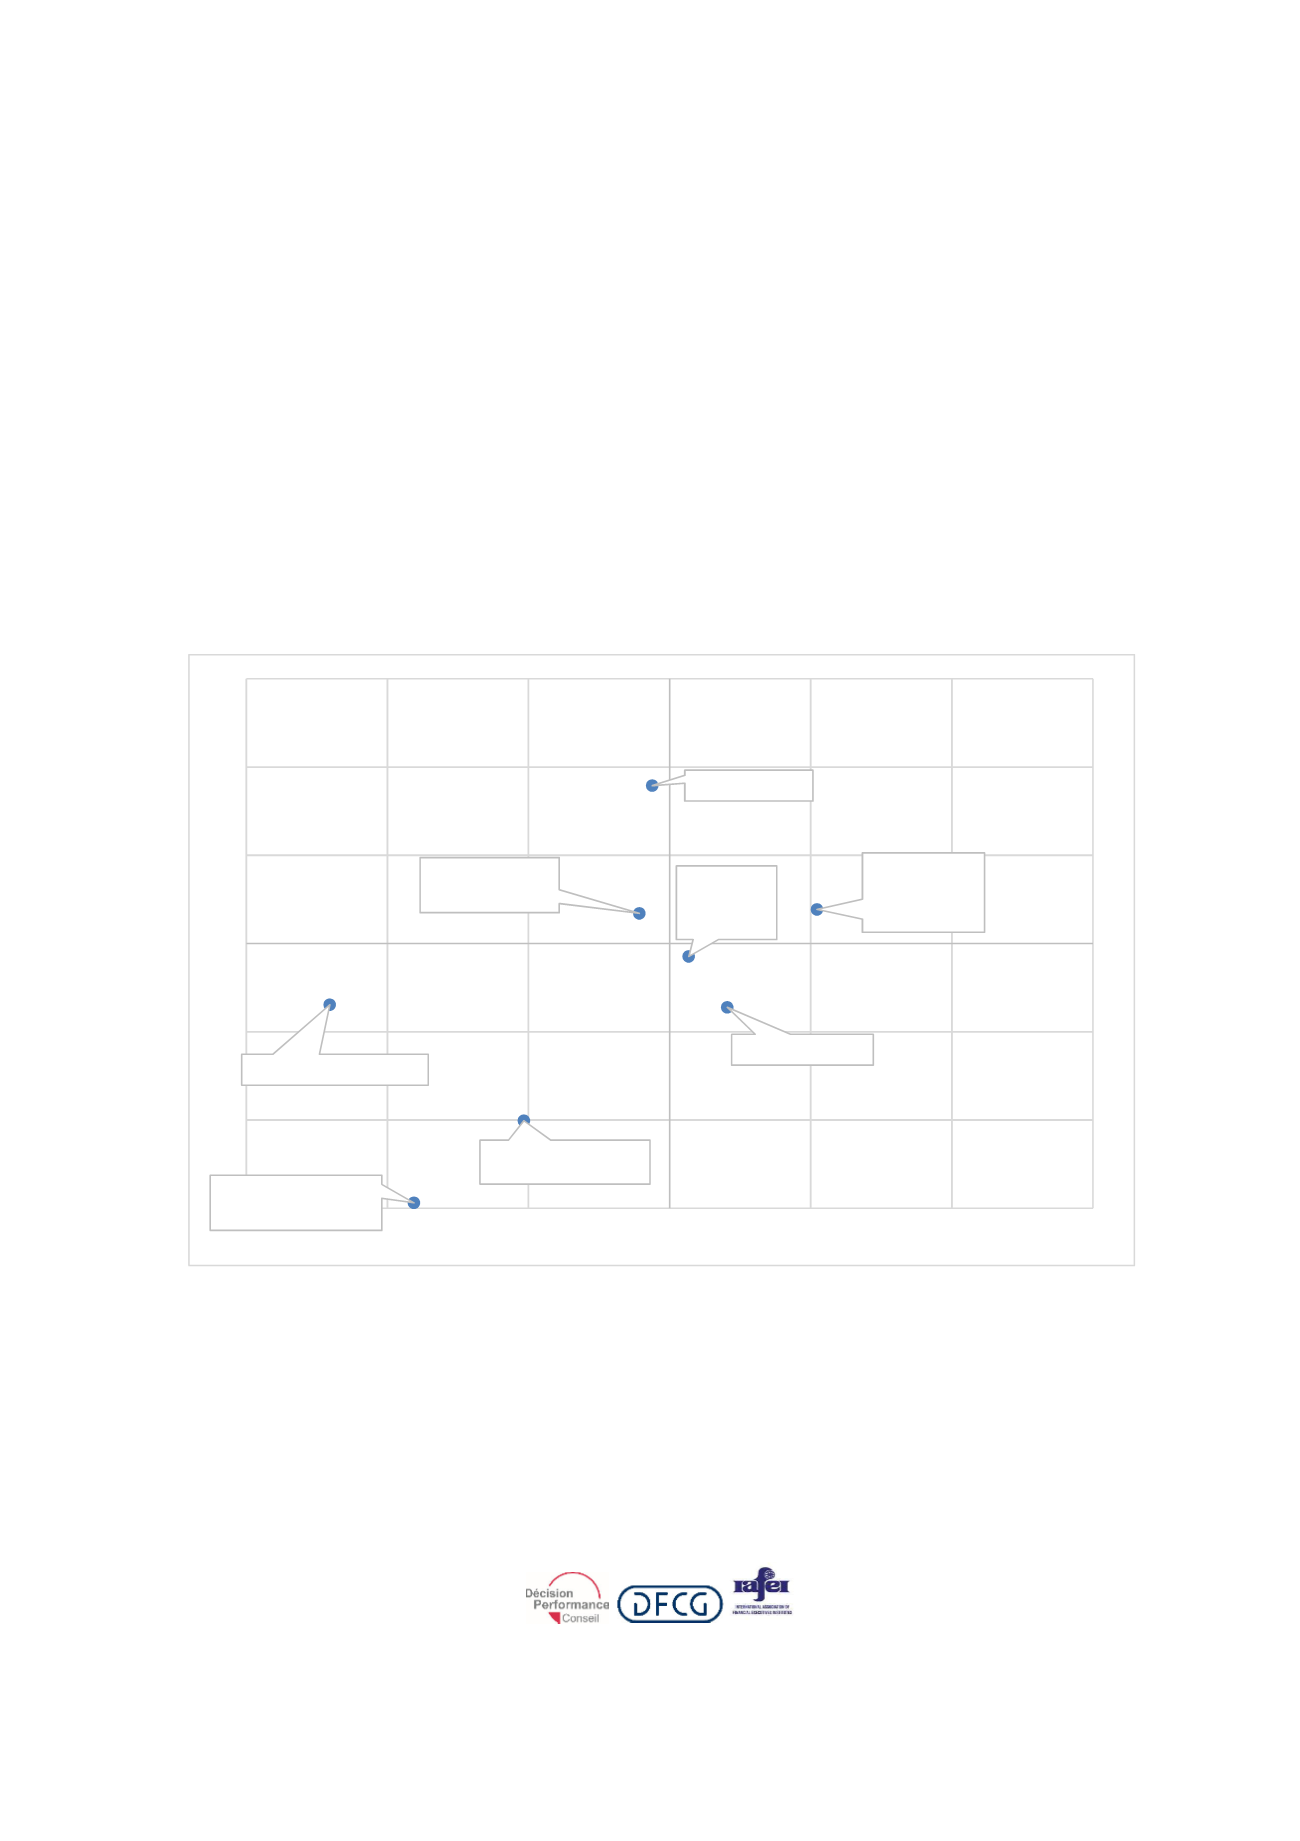
their working time according to their Value-added perception; there are however some
exceptions (See graph below).
Planning and Budgeting activity can be observed to have an average Value-added OR
added value, involving a lot of time (increase by +0.5 pts vs 2015)
Working with the operational departments is the activity showing the highest Value-
added (increase by +0.4 pts Vs 2015) but needing an average time
Forecasting, Variance Analysis and Business Reviews are well balanced and are thus
positioned in the middle of the graph
Production Reporting seems to be unbalanced as its Value-added OR Added value is low
but the dedicated time is average, implying a lack of automatic process i.e. tasks are quite
manual
Internal Audit / Risk Management seems to be the new challenge as its Value Added value
is higher than the dedicated time. This task seems undeveloped and Controllers may have
to spend time on this topic in the future. There is a similar situation concerning IT systems
thanks to the deployment of Big Data
Reporting production
Plan & Budget
Variance
analysis
Forecasts & Re-
Forecasts
Business review
Working with
operational
departments
IT systems
Internal audit / Risk
management
0,1
0,11
0,12
0,13
0,14
0,15
0,16
0,1
0,11
0,12
0,13
0,14
0,15
0,16
Added Value
Dedicated time
IAFEI Quarterly | 18