


 49 / 54

Press, Journal Article
3
But reality upended the central bankers’ best-laid plans. Officials
learned that some participants in the “phone a friend” market could
not legally earn the Fed’s posted rate (we see you, Federal Home Loan
Banks!). These participants in the market willingly lent out their ex-
cess balances for less than the posted rate. The Fed’s first plan to man-
age front end interest rates failed.
Necessity is, of course, the mother of invention. A team at the New
York Federal Reserve Bank hatched a new plan to appeal to a wider
array of money market participants. A new tool was born: the fixed-
rate, full-allotment overnight reverse repurchase facility (ON RRP).
3
Jargon-free, this new tool is just like having an overnight deposit ac-
count at the Fed for the non-bank institutions, with deposits backed
by collateral the Fed holds on its balance sheet (all the bonds acquired
with QE!).
With these two new tools, the Fed has maintained an iron grip on
overnight interest rates. Most important for investors, the use of the
ON RRP means that for the first time in history, institutional inves-
tors (i.e., non-broker-dealers and non-banks, such as money funds)
have direct access to deposits at the Fed—a bit like having a checking
account at the Fed. Said differently, the Fed has its tentacles wrapped
around money markets like never before.
MAKING BANK RESERVES SCARCE AGAIN!
4
So the Fed’s balance sheet is large. Yet policymakers seem intent on
raising short-term interest rates. But, control of short-term rates de-
pends, at least in part, on use of securities on the big balance sheet
(the ON RRP).
Before we go too far, you might be thinking: “Well, if the Fed created
all of these extra reserves to pay for the bond purchases under the
various QE programs,
why not just sell the bonds?
By selling, reserve
balances would also fall. Making reserves scarce would return the Fed
to the comfortable confines of the pre-crisis mechanics in order to im-
pact overnight interest rates by constraining or expanding the supply
of reserves. End of story. Right?”
Not quite. While this is the first and simplest option, the Fed has
a problem with selling the bonds before hiking interest rates to an
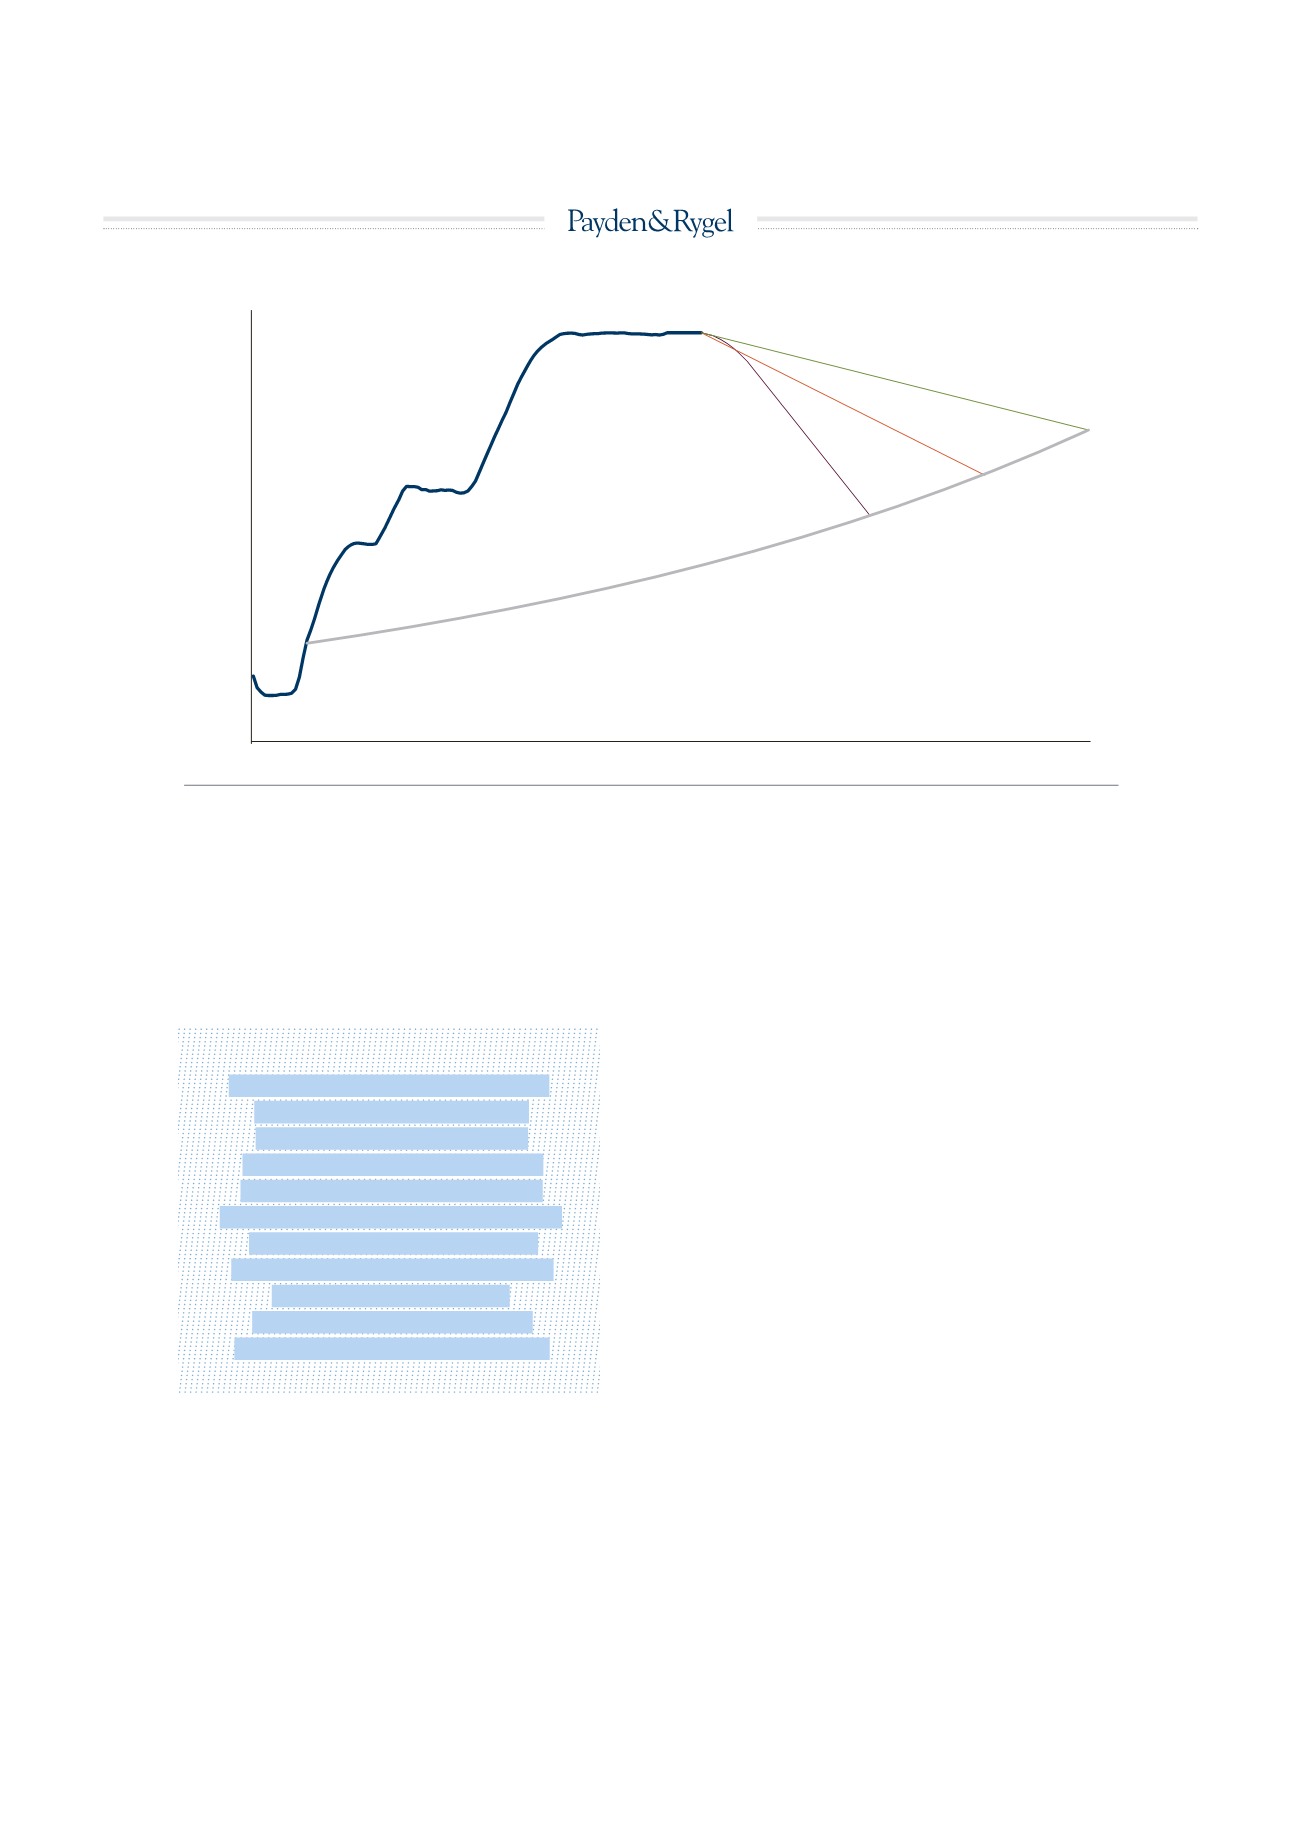
USD Trillions
Source: Federal Reserve, Payden Economics
$0.0
$0.5
$1.0
$1.5
$2.0
$2.5
$3.0
$3.5
$4.0
$4.5
2008 2009 2010 2011 2012 2013 2014 2015 2016 2017 2018 2019 2020 2021 2022 2023 2024 2025 2026
August 2021
Feb 2024
May 2026
Minimum, “Normal” Balance Sheet Size
(based on the historical growth rate of 7%,
driven by natural growth in US currency
used in the global economy).
Moderate
($20 bln/mo)
Baseline
($10 bln/mo)
Aggressive
(scale back reinvestment
according to current plan,
avg. ~ $45 bln/mo)
Federal Reserve’s
Securities Holdings
PATH OF THE FEDERAL RESERVE’S BALANCE SHEET UNDER VARIOUS SCENARIOS
fig. 3
«UNDER SUCCESSIVE QE
PROGRAMS, THE FED
INCREASED THE SIZE
OF ITS BALANCE SHEET
FROM $800 BILLION TO
MORE THAN $4.5 TRILLION
(SEE AGAIN FIGURE 2).
HOW DID THAT HAPPEN?
THE FED CREATED
$2.6 TRILLION IN NEW
LIABILITIES (RESERVES).»
49