


 50 / 54

Press, Journal Article
4
as-yet-unstated level. The uncertainty of selling all those bonds may
spook the bond market. Consider that a few words from former Fed
chairman Ben Bernanke spoken in spring of 2013 sparked a 150 basis
point sell off in 10-year Treasuries (the so-called “Taper Tantrum”),
which, in turn, spiked mortgage rates and sent home sales into a re-
newed slump.
The minutes of the March 2017 FOMC meeting show that the Fed
prefers a “passive and predictable” roll-off of both Treasuries and
MBS.
5
We learned in June 2017 what this would mean. The unwind
process will permit $6 billion of Treasury securities and $4 billion
of agency debt and mortgage- backed securities (MBS) to roll off
the Fed’s balance sheet each month. Note: the Fed will not be selling
assets, only collecting the coupon, principal and maturity payments
below the $10 billion monthly “cap” and returning those proceeds to
the U.S. Treasury—just like any normal bond investor might sweep
maturities out of a portfolio to meet payroll obligations instead of
selling a bond. If future economic conditions warrant shrinking the
balance sheet further, every three months the initial caps will increase
by $6 billion (Treasuries) and $4 billion (agency and MBS), up to a
maximum of $30 billion in Treasuries and $20 billion in agency and
MBS per month.
In the meantime, since the future is unknown, we’ve mapped out three
scenarios for the balance sheet (
see Figure 3 on page 3
). Even in the
“aggressive” scenario in which the Fed ceased all reinvestment of the
proceeds of its bond portfolio today—and maintained that policy for
four years—the balance sheet would still exceed $2 trillion in 2021.
Further, as mentioned above, the balance sheet would have grown
naturally without the crisis of 2008. A simple extrapolation at the his-
torical rate of growth in demand for the nation’s currency of 7% puts a
floor under the balance sheet over time (the gray line).
Given what we know now, our best guess is that by decade’s end the
balance sheet will still be $2-3 trillion. But the intersect between those
two lines may end up being higher. In short, a big balance sheet in
dollar terms is here to stay—we are not going back to $800 billion.
6
EMBRACE THE BIG BALANCE SHEET
Inquiring bond investor minds want to know: what does the unwind
mean for interest rates? Telling the tale above is absolutely necessary
for understanding what might happen next. We reach several conclu-
sions, first concerning short-term rates and second longer-term rates.
The Fed’s control of short-term rates has been successful so far, and
the Fed’s ability to control the federal funds rate and other short-term
interest rates will remain the key tool of monetary policy. All else
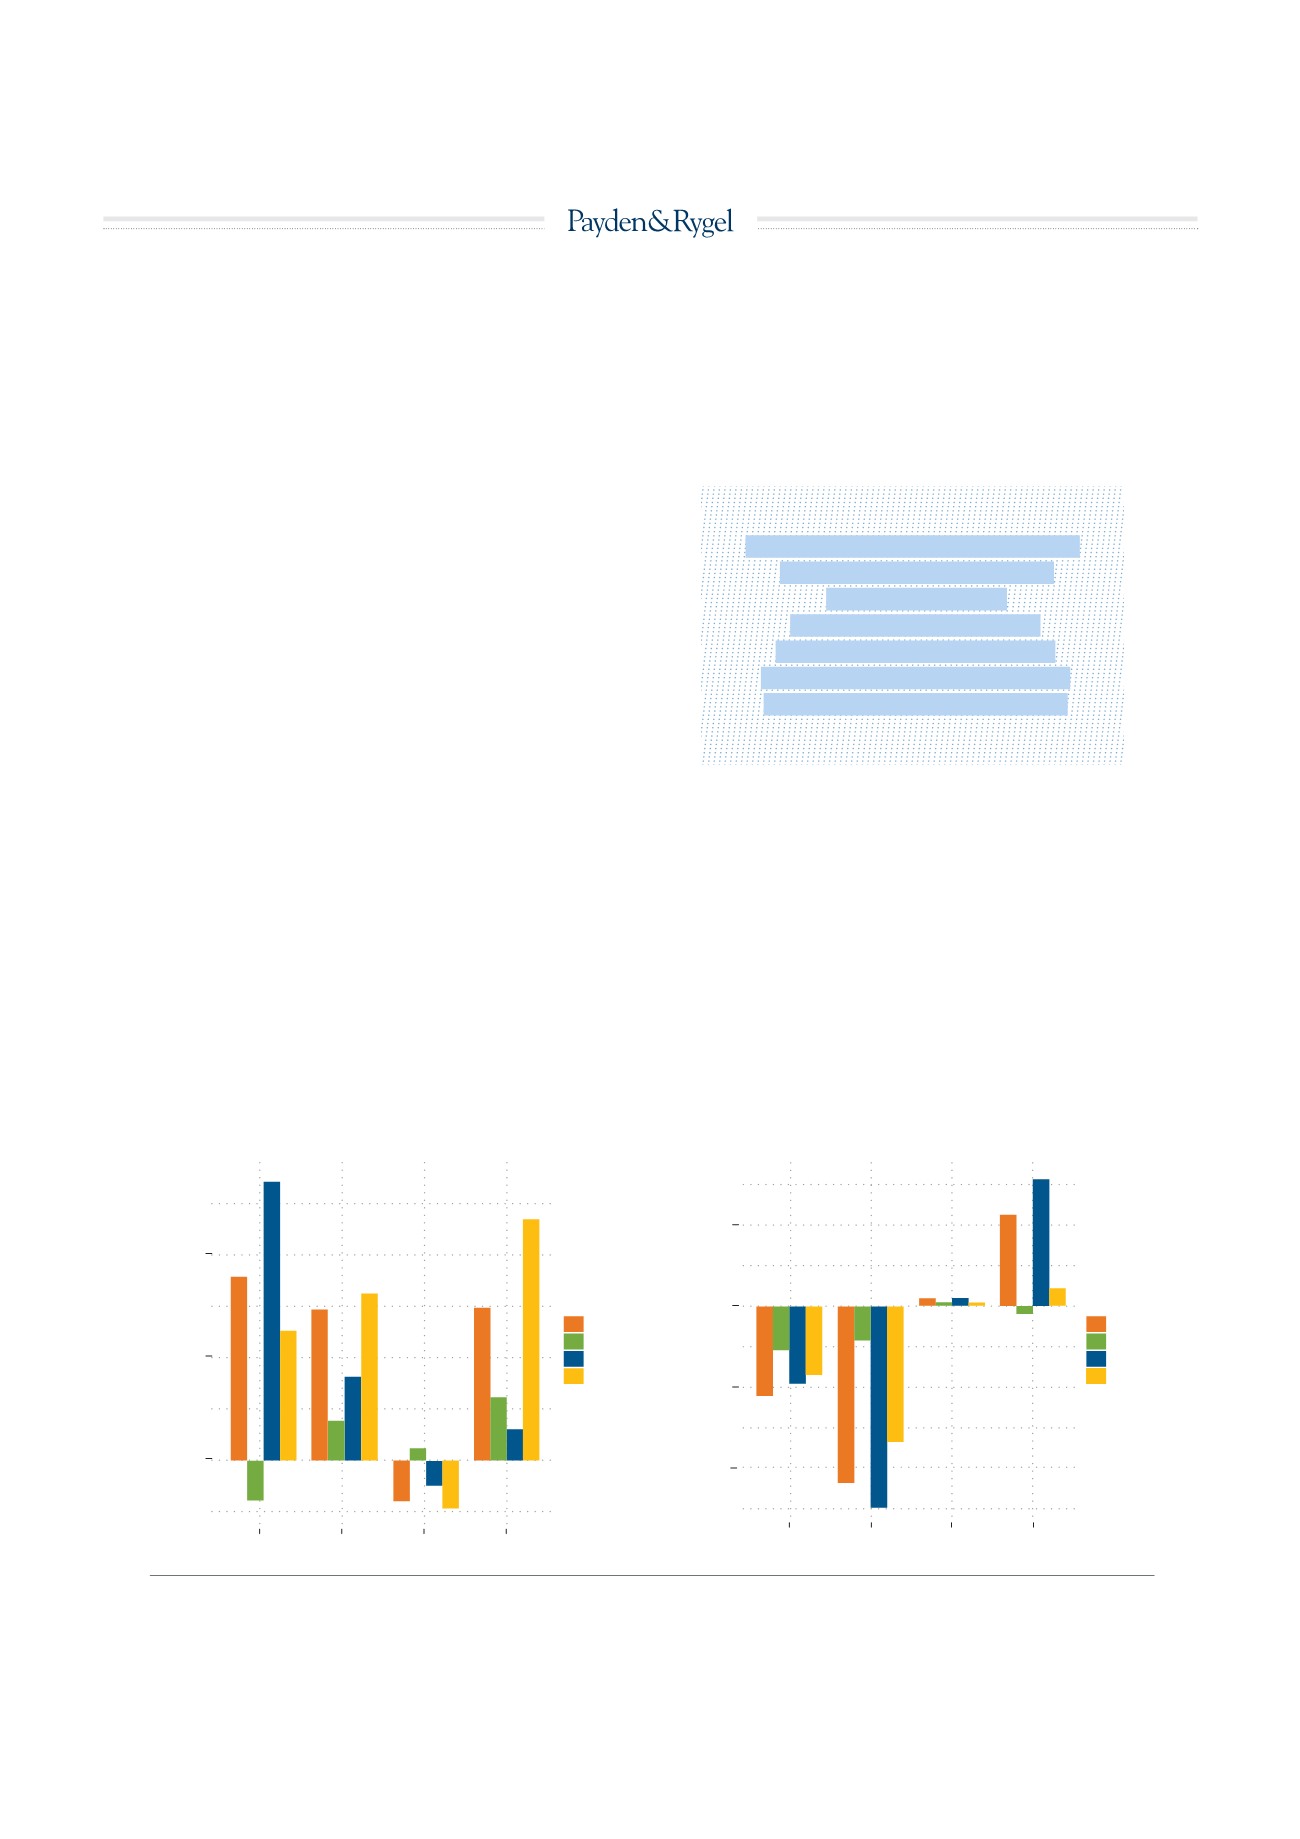
Change in Yields
DURING
QE Programs
Source: Federal Reserve, Payden Economics
Change in Yields 12 Months
AFTER
QE Programs
2-year
30-year
5-year
10-year
Tenor
Yield Change (%)
0.8
0.4
0.0
2-year
30-year
5-year
10-year
Tenor
Yield Change (%)
0.5
0.0
-0.5
QE1
QE2
Twist
QE3
Program
-1.0
QE1
QE2
Twist
QE3
Program
WHAT DOES THE BALANCE SHEET MEAN FOR THE LONG-END OF THE YIELD CURVE? IT IS HARD TO SAY.
fig. 4
«THE LESSON: INVESTORS
SHOULD INFER VERY
LITTLE ABOUT
THE DIRECTION OF
LONGER-TERM RATES
FROM CHANGES IN THE
FED’S BALANCE SHEET.»
50