


 25 / 40

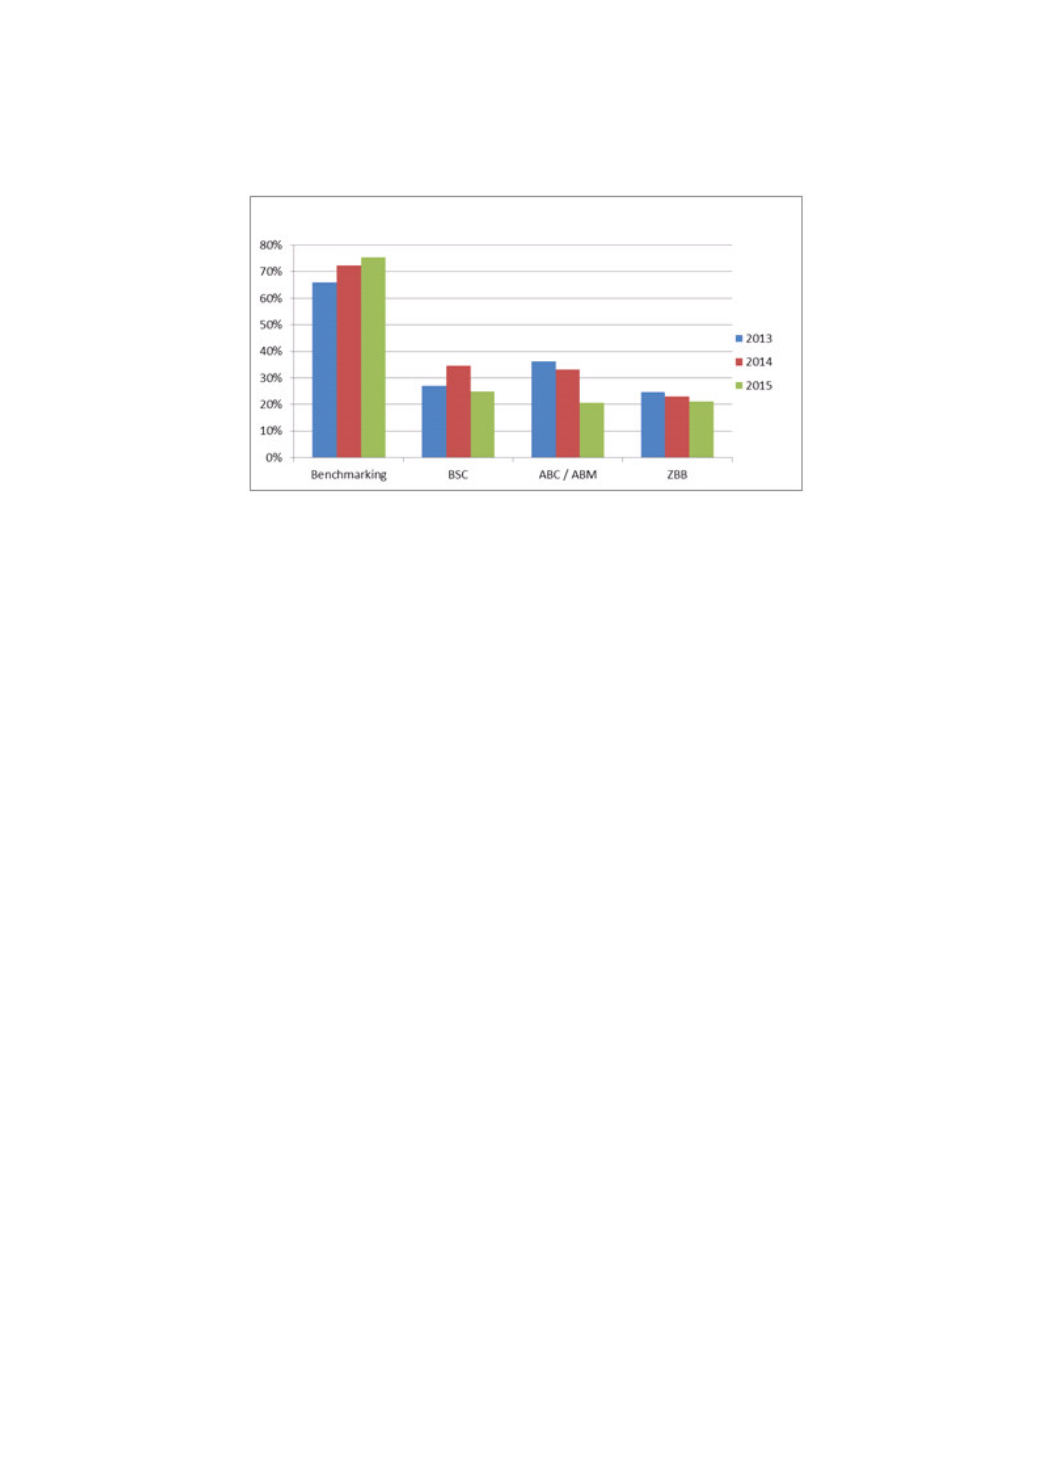
The Balanced scorecard (BSC) method ranks second at 25%, followed by Activity-based costing/Activity-based
management (ABC/ABM) and Zero-based budget (ZBB) both at 21%, which entails a sharp drop from the 2014 levels
for BSC and ABC.
Fig. 18 Utilization trend of methods
As in 2014, there is a certain homogeneity in the use of methods depending on the revenue of companies. Overall,
70% of respondents using methods do so in companies with a revenue less than 250 million Euros; the balanced
scorecard method has convinced the most users in companies with a revenue over 1 billion Euros; and benchmarking
seems more accessible and is used by 50% respondents or more, regardless of company size.
Stock exchange listing and public ownership do not appear to influence the use of methods. Only one third of the
companies using the balanced scorecard and external benchmarking are listed. Internal benchmarking and ABC seem
to be used to a lesser extent in listed companies.
The disparities observed in 2014 regarding the influence of the economic situation on the use of methods seem to be
confirmed. In all, 61% of respondents using methods come from growing companies (14% in companies with high
growth and 47% in companies with slight growth). Without any evidence, it appears that the regular use of methods
may help companies return to growth, and for some, amplify the results.
From a geographical perspective, we observed a few changes. In 2015, Europe accounts for almost 50% of the
respondents and users of methods. Born in the US in the 1990s, benchmarking remains without surprise the most
used method in the US (60%). The strong international presence of US companies may have promoted the method in
the rest of the world, including Europe, where the method is used by 50% of the respondents. The balanced scorecard
(BSC) method is the 2nd most used method in Europe and in the US.
IAFEI Quarterly | Special Issue | 24