


 30 / 40

Not enough reporting templates ready to use and links
to detailed transactional data, no integration
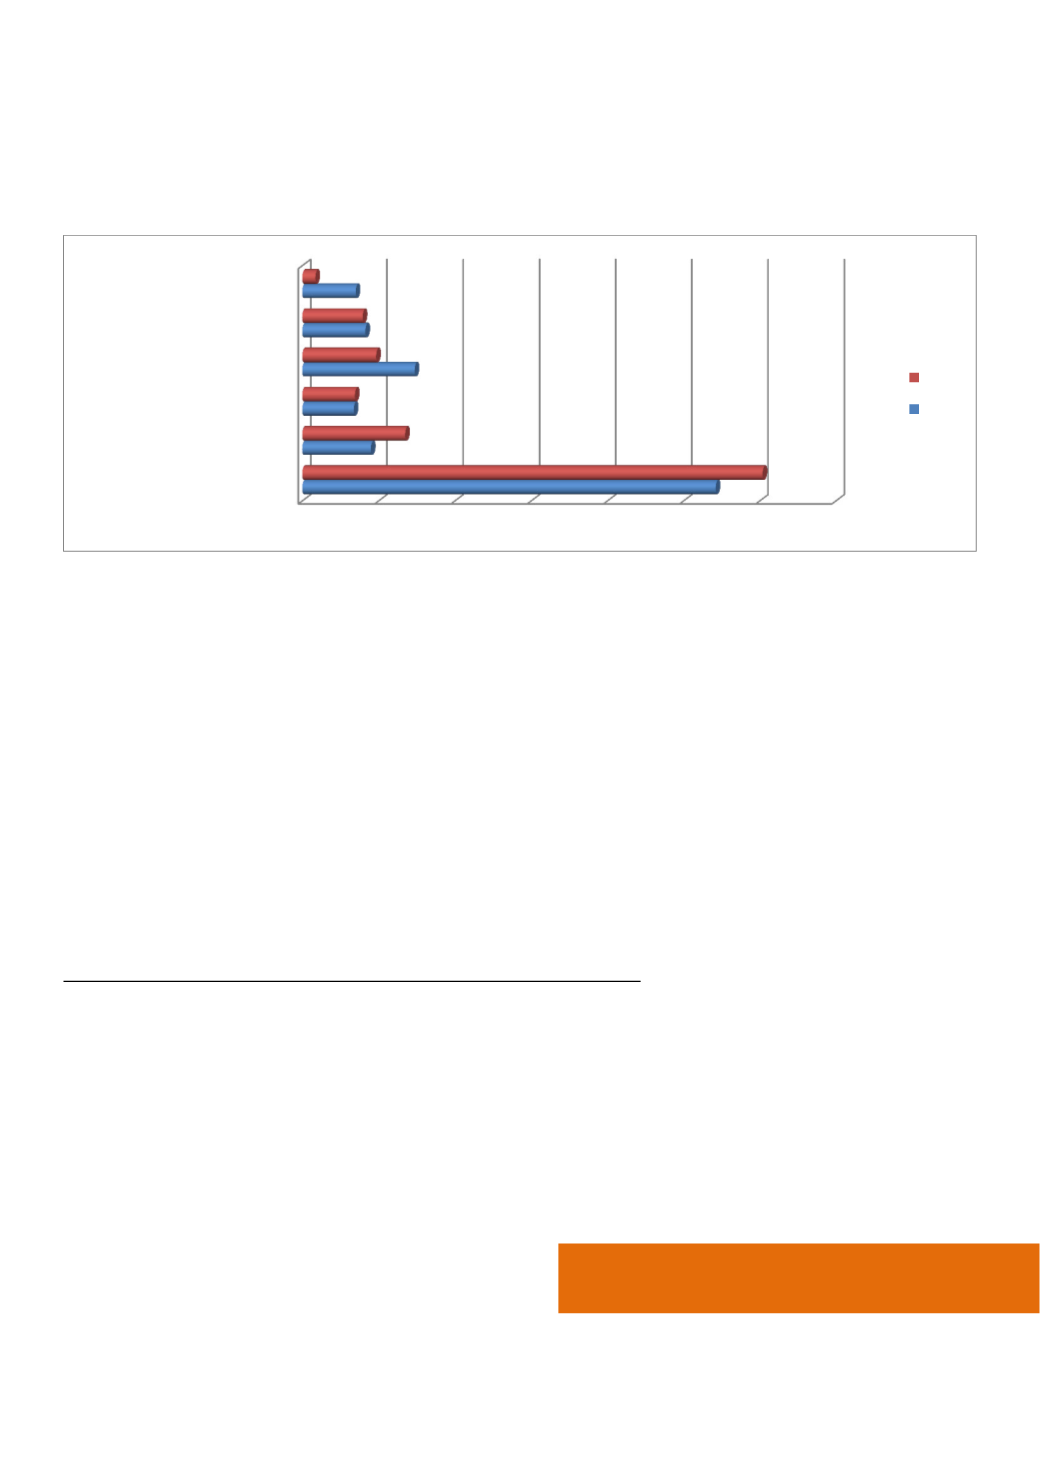
The spreadsheet remains the favorite tool
Observations made in the surveys in previous years are still true: the spreadsheet remains the favorite tool for 54% of
respondents (2014: 60%).
Fig. 22 Main tools used for all activities
A spreadsheet has many disadvantages: formulae maintenance, frequent miscalculations, data inconsistencies,
duplication, etc. Despite all these limitations, it remains the most used tool. The flexibility of spreadsheets
compensates all these drawbacks.
As soon as the process becomes recurrent, the rate of use of spreadsheets decreases. This rate decreases constantly
from planning to budgeting (from 60% to 56%) and from budgeting to reporting (where the rate reaches 40%).
͞After iŵpleŵeŶtiŶg “AP, we edžpeĐt
to get rid of Excel spreadsheets. In fact, the opposite happens, with more data
available and the flexibility spreadsheets provide.
͟
Esther Veaux
, Chief Financial Officer, National Museum of Natural History
Spreadsheet use is lower for listed companies. Being listed or not is the most significant criteria regarding tools used
for controlling. It is possible that given the regular data production constraints and deadlines listed companies are
subject to, they have industrialized production processes of financial data. Another assumption is that budget
processes are more complex and need to be rigorous and quickly alterable (size effect). Hence, listed companies
cannot accept any longer data crunching that is a source of errors and is time-consuming, and they prefer using
dedicated tools.
0,0% 10,0% 20,0% 30,0% 40,0% 50,0% 60,0% 70,0%
Only spreadsheets
ERP
Consolidation tool
Budgeting tool
Multi-dimensional program
Integrated dashboard tool
2014
2015
IAFEI Quarterly | Special Issue | 29